The following on the Marshall Islands, the Federated States of Micronesia and Palau is a compilation of each location’s Graduate School USA annual Economic Review for fiscal 2016. The annual reviews provide a comprehensive update to the islands’ finance and economic statistics, including such indicators as gross domestic product, GDP per capita, employment, inflation, external debt ratios, consolidated revenues and expenditures and outmigration estimates. The full reviews were first published in July and August by the Pacific & Virgin Islands Training Initiatives, Graduate School USA (www.pitiviti.org).
Marshall Islands
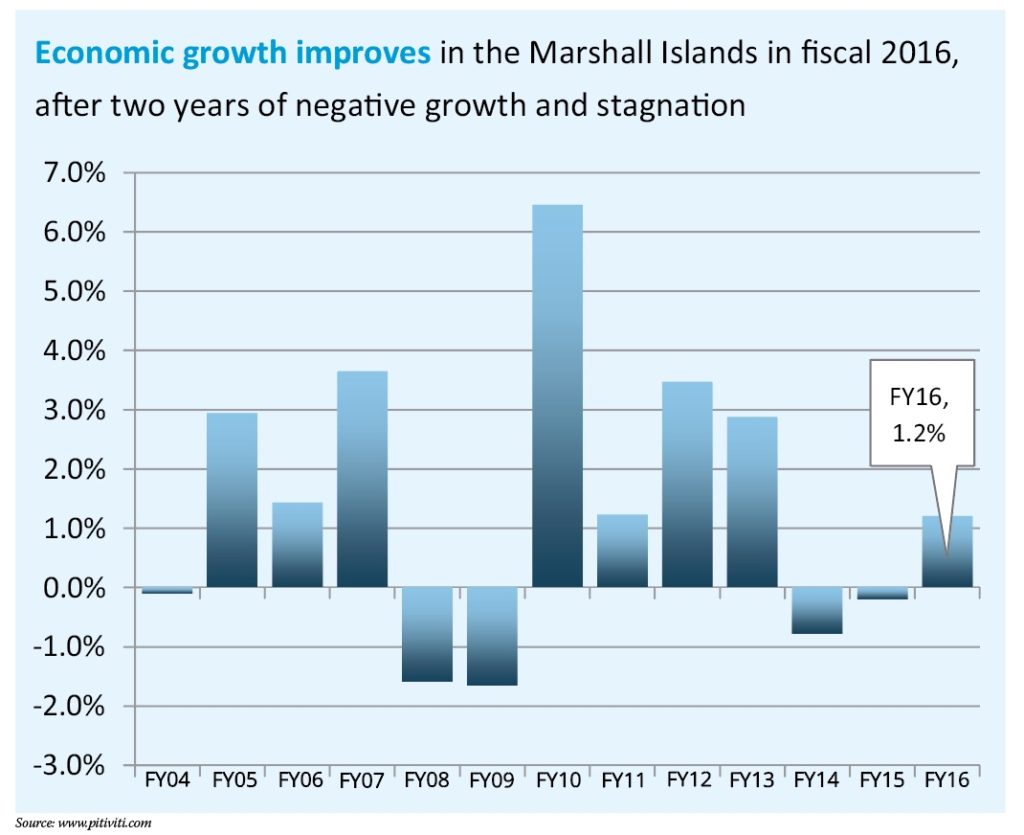
GDP recorded an improved performance in fiscal 2016, with 1.9% growth in GDP after two years of negative growth. The major driver of the improved performance was an increase in construction activity following a resumption in disbursements of the Compact infrastructure grant after the halt in fiscal 2014 and fiscal 2015. Public administration also contributed to the upturn, reflecting increases in central government, local government and agency spending. On the downside, fisheries activity slowed as Pan Pacific underwent regulatory issues in conforming to international shipping regulations.
Employment
During the amended Compact, employment growth averaged 0.7% annually, but all the growth was in the initial years through fiscal 2010. Since that time, employment levels have remained unchanged. While employment at the central government has remained largely stationary since fiscal 2010, that in the public sector at large has grown by 1.8% per annum, reflecting increased employment opportunities in the state-owned enterprise sector, government agencies and local government. Meanwhile, private sector employment fell by 2.3%, offsetting the increase in the public sector. Clearly, employment generation in recent years has been unable to provide an increasing source of job opportunities for the growing population.
Inflation
With the substantial declines in world oil prices continuing to filter through the Marshall Islands economy, inflation fell for the second consecutive year: by 1.5% compared with a drop of 2.2% the year earlier. Food prices declined by 1.4%, together with reductions in housing prices by 3.6% and transport prices by 2.5%, all helping to moderate the cost of living.
Banking
A particular issue for the Marshall Islands has been the worldwide phenomenon of “derisking” by international financial institutions. To reduce exposure to money laundering and to avoid stiff penalties imposed by regulatory authorities, international banks are reducing their exposure through limiting correspondent relationships. The Bank of the Marshall Islands is under threat of loss of its correspondent bank, First Hawaiian Bank, and unless attempts to secure alternative arrangements are achieved, the Marshall Islands financial sector is at significant risk. It is understood that significant tightening of banking practices and procedures will be required.
The fiscal outturn
The Marshall Islands achieved a record fiscal surplus in fiscal 2016 of 4% of GDP, the third year in a row of strong performance. Revenues grew strongly, reflecting growth in taxes but dominated by growth in nontax revenue: fishing fees and receipts from the corporate and ship registry. From $4 million in fiscal 2012, fishing fees received by government have now attained $26 million. On the expenditure side, payroll expense grew modestly in fiscal 2016, by 2.2%, but use of goods and services expanded by 22% ($5.7 million). While subsidies and transfers to other public-sector entities continue to pose a significant fiscal threat, they remained unchanged at their fiscal 2015 levels. Outlays on miscellaneous project expenses also grew strongly: by 68% ($4.8 million).
The very significant improvement in the fiscal position has unfortunately been accompanied by large matching increases in expansionary budgets during the last two fiscal periods. While the government should be congratulated for attaining significant surpluses, the lack of discipline in controlling expenditures is of serious concern. Fiscal policy lacks a fiscal-responsibility framework to encourage the prudential management of abundant current resources to meet future needs arising from declining Compact grants, an insufficient Compact Trust Fund corpus to reliably replace the grants, and a perilously underfunded social security system.
External debt
The Marshall Islands external debt remains significant, and was characterized by the International Monetary Fund in a recent debt-sustainability analysis as reaching levels that placed the Marshall Islands at a “high risk of debt distress.” Nevertheless, external debt continued to decline as average percentage of GDP, falling from 72% of GDP at the start of the amended Compact to 43% in fiscal 2016. In terms of debt service, total repayments of principal and interest represent 11% of general fund revenues: a measure of unconstrained government revenues. Debt service was a major issue for the government in the past in periods of delinquency. However, the Marshall Islands has resolved these issues and has been up to date during recent years. As a result of its designation as being at “high risk of debt distress,” the Marshall Islands has now been accorded grant-only status by the World Bank and the Asian Development Bank, and is no longer eligible for concessionary loan finance. This has both benefits and costs, but ushers in a period of enforced declining debt to GDP as existing loans are repaid.
Federated States of Micronesia
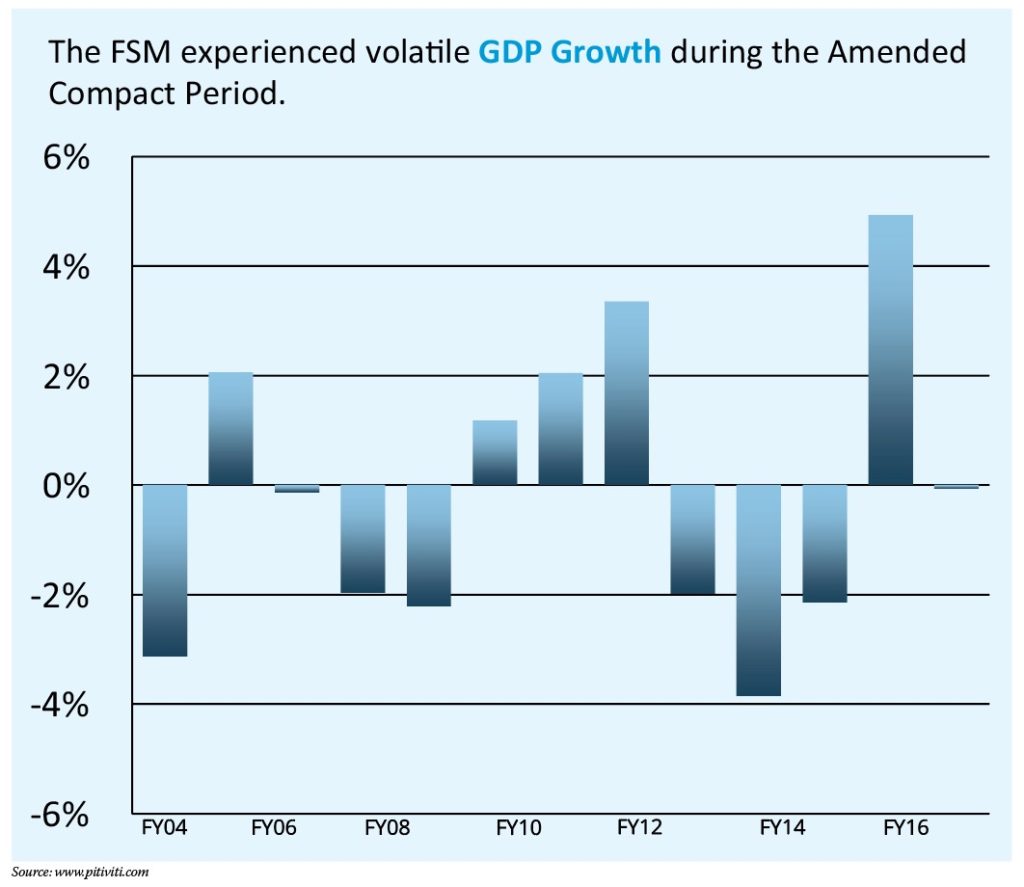
After experiencing strong growth in fiscal 2015 of 4.9%, the FSM economy remained flat in fiscal 2016 and GDP fell by 0.1%. The component of FSM GDP resulting from domestic purse seine fishing operations adds considerably to the volatility of year-to-year growth rates. Excluding those domestic purse seine fishing operations, and despite continuing issues with the use of the Compact infrastructure grant, the FSM’s domestic economy grew by a respectable 2.3% in fiscal 2015 and 2.1% in fiscal 2016. During the first six years of the amended Compact, economic performance was weak in the FSM due to difficult
adjustments to the new Compact. However, the following four years saw improvement, in large part resulting from the strong demand for infrastructure. The poor results in the following period (fiscal 2012 to fiscal 2014) reflect management issues with the use of the Compact infrastructure grant. With agreement on construction management and procurement procedures in mid-2017, it is hoped that the large backlog of infrastructure funds remaining under the amended Compact will have underpinned a sustained higher growth trajectory.
Employment
After a period of stagnant employment conditions since fiscal 2011, the improved conditions in the FSM’s domestic economy led to employment growth of 1.7% in fiscal 2016. Private sector employment was the driving force, which grew by 1.9% — although job prospects in the public sector also improved. Since the start of the amended Compact, private sector employment has remained flat while that in the public sector has declined by 15% as the FSM governments have downsized reflecting reductions in the real value of Compact funding. Overall, jobs fell by 7% since fiscal 2003.
Inflation
With the substantial declines in world oil prices continuing to filter through the FSM economy, inflation fell by 1% compared with the year earlier. Food and fuel prices, the main drivers of inflation in the FSM, declined — helping to moderate the cost of living.
Banking
The deposit base in the FSM banking system ($258 million in fiscal 2016) has grown significantly reflecting a sound financial system. However, lending performance to the private sector has been weak and represents only 19% of the deposit base, one of the lowest in the region. The resulting surplus liquidity, now more than $203 million, is invested offshore in low yielding assets. The low rate of domestic lending reflects the perceived high risk of lending in the FSM and “lack of bankable projects.” Overall, the inability of businesses to prepare credible business plans and financial statements, lack of collateral, the limited ability to use land as security and inadequate provisions to secure transactions have inhibited development of the financial sector. With limited opportunities, commercial banks have preferred to invest their assets offshore in less risky and more secure markets.
The fiscal outturn
The overall fiscal balance recorded a surplus in fiscal 2016 of $24.1 million, or 7.4% of GDP. This was a significant reduction from the fiscal 2015 levels of $32.7 million and 10.4% of GDP, despite an increase in domestic (non-grant) revenues. There was a significant expansion in public expenditures, arising from the recent increases in fiscal space, leading to the reduction in the size of the surplus. However, the fiscal outturn differed significantly between the FSM national and state governments. The national government ran a surplus of $26.6 million, while all states recorded small deficits, amounting to $2.5 million. The FSM state governments, where service delivery occurs, have been constrained by the declining real value of Compact grants, while the national government has benefited from a boom in revenues from fishing fees and, to a lesser extent, the captive insurance market. While national revenues peaked in fiscal 2014, they remain at a sustained high level.
External debt
The FSM’s external debt, at 26% of GDP and 18% net of offsetting assets (sinking fund), is one of the lowest in the region. Debt service of 7% of national government domestic revenues remains well within the capacity of the national government to service, and does not present any threat of debt stress. A recent review by the FSM public auditor revealed many weaknesses in the FSM’s external debt management. As a result, a debt management bill has been drafted but has yet to be acted upon by the FSM Congress. While our analysis indicates that the FSM is not at risk of debt stress, the standard IMF Debt Sustainability Analysis places the FSM in an at-risk category. The debt analysis assumes that large fiscal shortfalls projected post-fiscal 2023 would be financed through (hypothetical) concessionary external borrowing. However, the FSM does not have access to the assumed persistent borrowing from donors, especially to maintain operational expenditures. While the IMF’s assumptions may be unrealistic, the consequence of the debt analysis is that the FSM has been accorded “grant only” status for access to resources. Under the current round of World Bank IDA funding, the FSM is thus not eligible for loan finance, but does qualify for up to $25 million grants annually, a very large increase in external aid compared with historical levels.
Palau
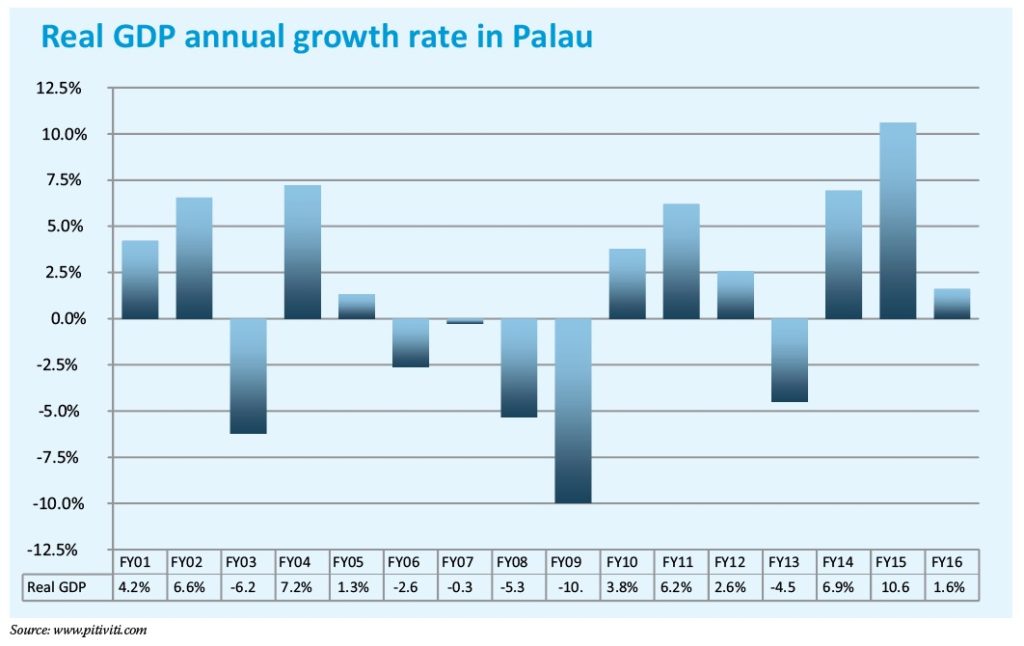
As the world economy fell into recession in fiscal 2008, the Palau economy suffered a severe contraction, and the economy had contracted by 15% in fiscal 2009 compared with two years earlier. Not only did tourism arrivals fall with declining world demand, but also the Compact Road project neared completion. In fiscal 2011 and fiscal 2012, the tourism economy rebounded, and the economy grew by 6.2% and 2.6%, respectively. In fiscal 2013 the economy contracted by 4.5%, reflecting completion of public construction projects in fiscal 2012 and a reduction in tourism because of a variety of structural factors. In fiscal 2014 and fiscal 2015 the tourism economy boomed, and GDP recorded a growth of 6.9% and a large 10.6%, respectively. In fiscal 2016 the economy continued to grow by 1.6% despite the drop-off in tourism as the forward momentum in the economy maintained growth. In fiscal 2017 the economy is projected to contract with further large reductions in demand for tourism.
Employment
The population of Palau consists of Palauans and a large number of foreign workers, mostly Filipinos. Since 1986 the Palauan component of the population grew by 0.2%, after allowing for external migration, reaching 12,890 in fiscal 2015. The number of foreign residents grew from 1,550 to 4,771 over the same period, reflecting the increased need for tourism-industry workers. GDP per capita has risen by 1.6% per annum since fiscal 2000. Gross national income attained a level of $15,028 in fiscal 2015, placing Palau in the World Bank’s high-income group by breaching the $12,476 threshold. The labor market in Palau is close to full employment, and Palauan employment has risen by 0.3% annually since fiscal 2000.
Banking
The World Bank’s ease-of-doing-business survey indicates that Palau ranks 136th out of the 190 countries surveyed, and suggests there is considerable room for improvement. A recent private sector assessment of Palau, conducted by the ADB, analyzes a range of issues where reforms are needed. Land tenure, as in many parts of the Pacific, is a constraint on development, and reforms to land-use planning in Palau are particularly important in regulating investment in the tourism sector. Despite improvements in secure transactions law, commercial bank lending is restricted by an inappropriate usury law and lack of business financial information to assist in lending appraisal. The regulatory framework for corporations, together with corporate registration and bankruptcy law, is in need of reform. Palau operates an old-style foreign-investment board approach to foreign direct investment regulation, which imposes a range of bureaucratic restrictions and requirements. The law has been recently amended to provide powers to the board to control “front” businesses: businesses owned by Palauans but operated by noncitizens. The original law, with a wide range of onerous requirements, was weakly enforced and encouraged the creation of fronts. However, whether the new law, which remains highly prescriptive, will have any more success remains to be seen.
The fiscal outturn
Palau has generally maintained a prudent fiscal policy. Between fiscal 2005 and fiscal 2013, it has recorded a fiscal balance in the range of -2.1% to 1.5% of GDP. With the onset of the economic recession in fiscal 2008 and fiscal 2009, the fiscal balance turned negative. However, since the recovery in fiscal 2011, the government has recorded surpluses in each year. As the economy boomed in fiscal 2014 a large surplus of 3.6% was recorded, with an even-larger surplus of 4.8% and 4.3% in fiscal 2015 and fiscal 2016, respectively.
External debt
On the external front, Palau has maintained a favorable position, with overall external debt falling to 22% of GDP in fiscal 2015. With large borrowings from the ADB for water, sanitation and internet connectivity projects coupled with borrowing from Taiwan for social projects, external debt is projected to peak at 31% by fiscal 2018 but remain at sustainable levels.
Editor’s note: On Dec. 12, President Donald J. Trump signed the fiscal year National Defense Authorization Act into law, also officially authorizing the strategic agreement signed between the United States and Palau governments in 2010. The original agreement proposed continued U.S. financial assistance totaling $229 million through 2024. At the time, full funding for the pact was not authorized. Beginning with fiscal 2010, subsequent Interior and discretionary appropriations acts have extended annual economic assistance to Palau of approximately $13.1 million a year for a total of $105.2 million in discretionary funds thus far.


